DRI Connect
A UX/UI design case study on creating a collaborative platform that transforms how global practitioners share knowledge about disaster-resilient infrastructure. Timeline: September 2022 - December 2022 (4 months) My Role: External UX/UI Design Consultant Client: Coalition for Disaster Resilient Infrastructure (CDRI) Engagement Type: Independent design consultancy from brief to design delivery

About CDRI & DRI Connect
Coalition for Disaster Resilient Infrastructure (CDRI): The CDRI is a global coalition launched in 2019, uniting member countries, international organizations, development banks, the private sector, and academic institutions to strengthen infrastructure resilience against climate and disaster risks. Its mission is to promote research, set standards, share knowledge, and influence policy frameworks that enhance disaster-resilient infrastructure worldwide fostering sustainable development and reducing economic losses due to disasters.
DRI Connect is CDRI’s digital knowledge exchange, learning, and collaboration platform, designed specifically for professionals working on resilient infrastructure DRI Connect. It serves as a central hub for:
E-learning courses
Events
Communities of Practice
Curated Resources (publications, case studies, videos, etc.)
It supports global engagement, capacity building, and co-creation in the field. As CDRI’s digital backbone, DRI Connect aggregates knowledge and facilitates continuous professional collaboration—enabling a more resilient global infrastructure ecosystem
The Design Challenge
The Coalition for Disaster Resilient Infrastructure (CDRI) approached our team with a complex problem: their global network of practitioners lacked a centralized way to share knowledge, collaborate, and access curated resources effectively.
“How might we design a platform that enables global practitioners, policymakers, and partners to effectively share knowledge, collaborate, and access curated resources for disaster‑resilient infrastructure?”
What I Discovered
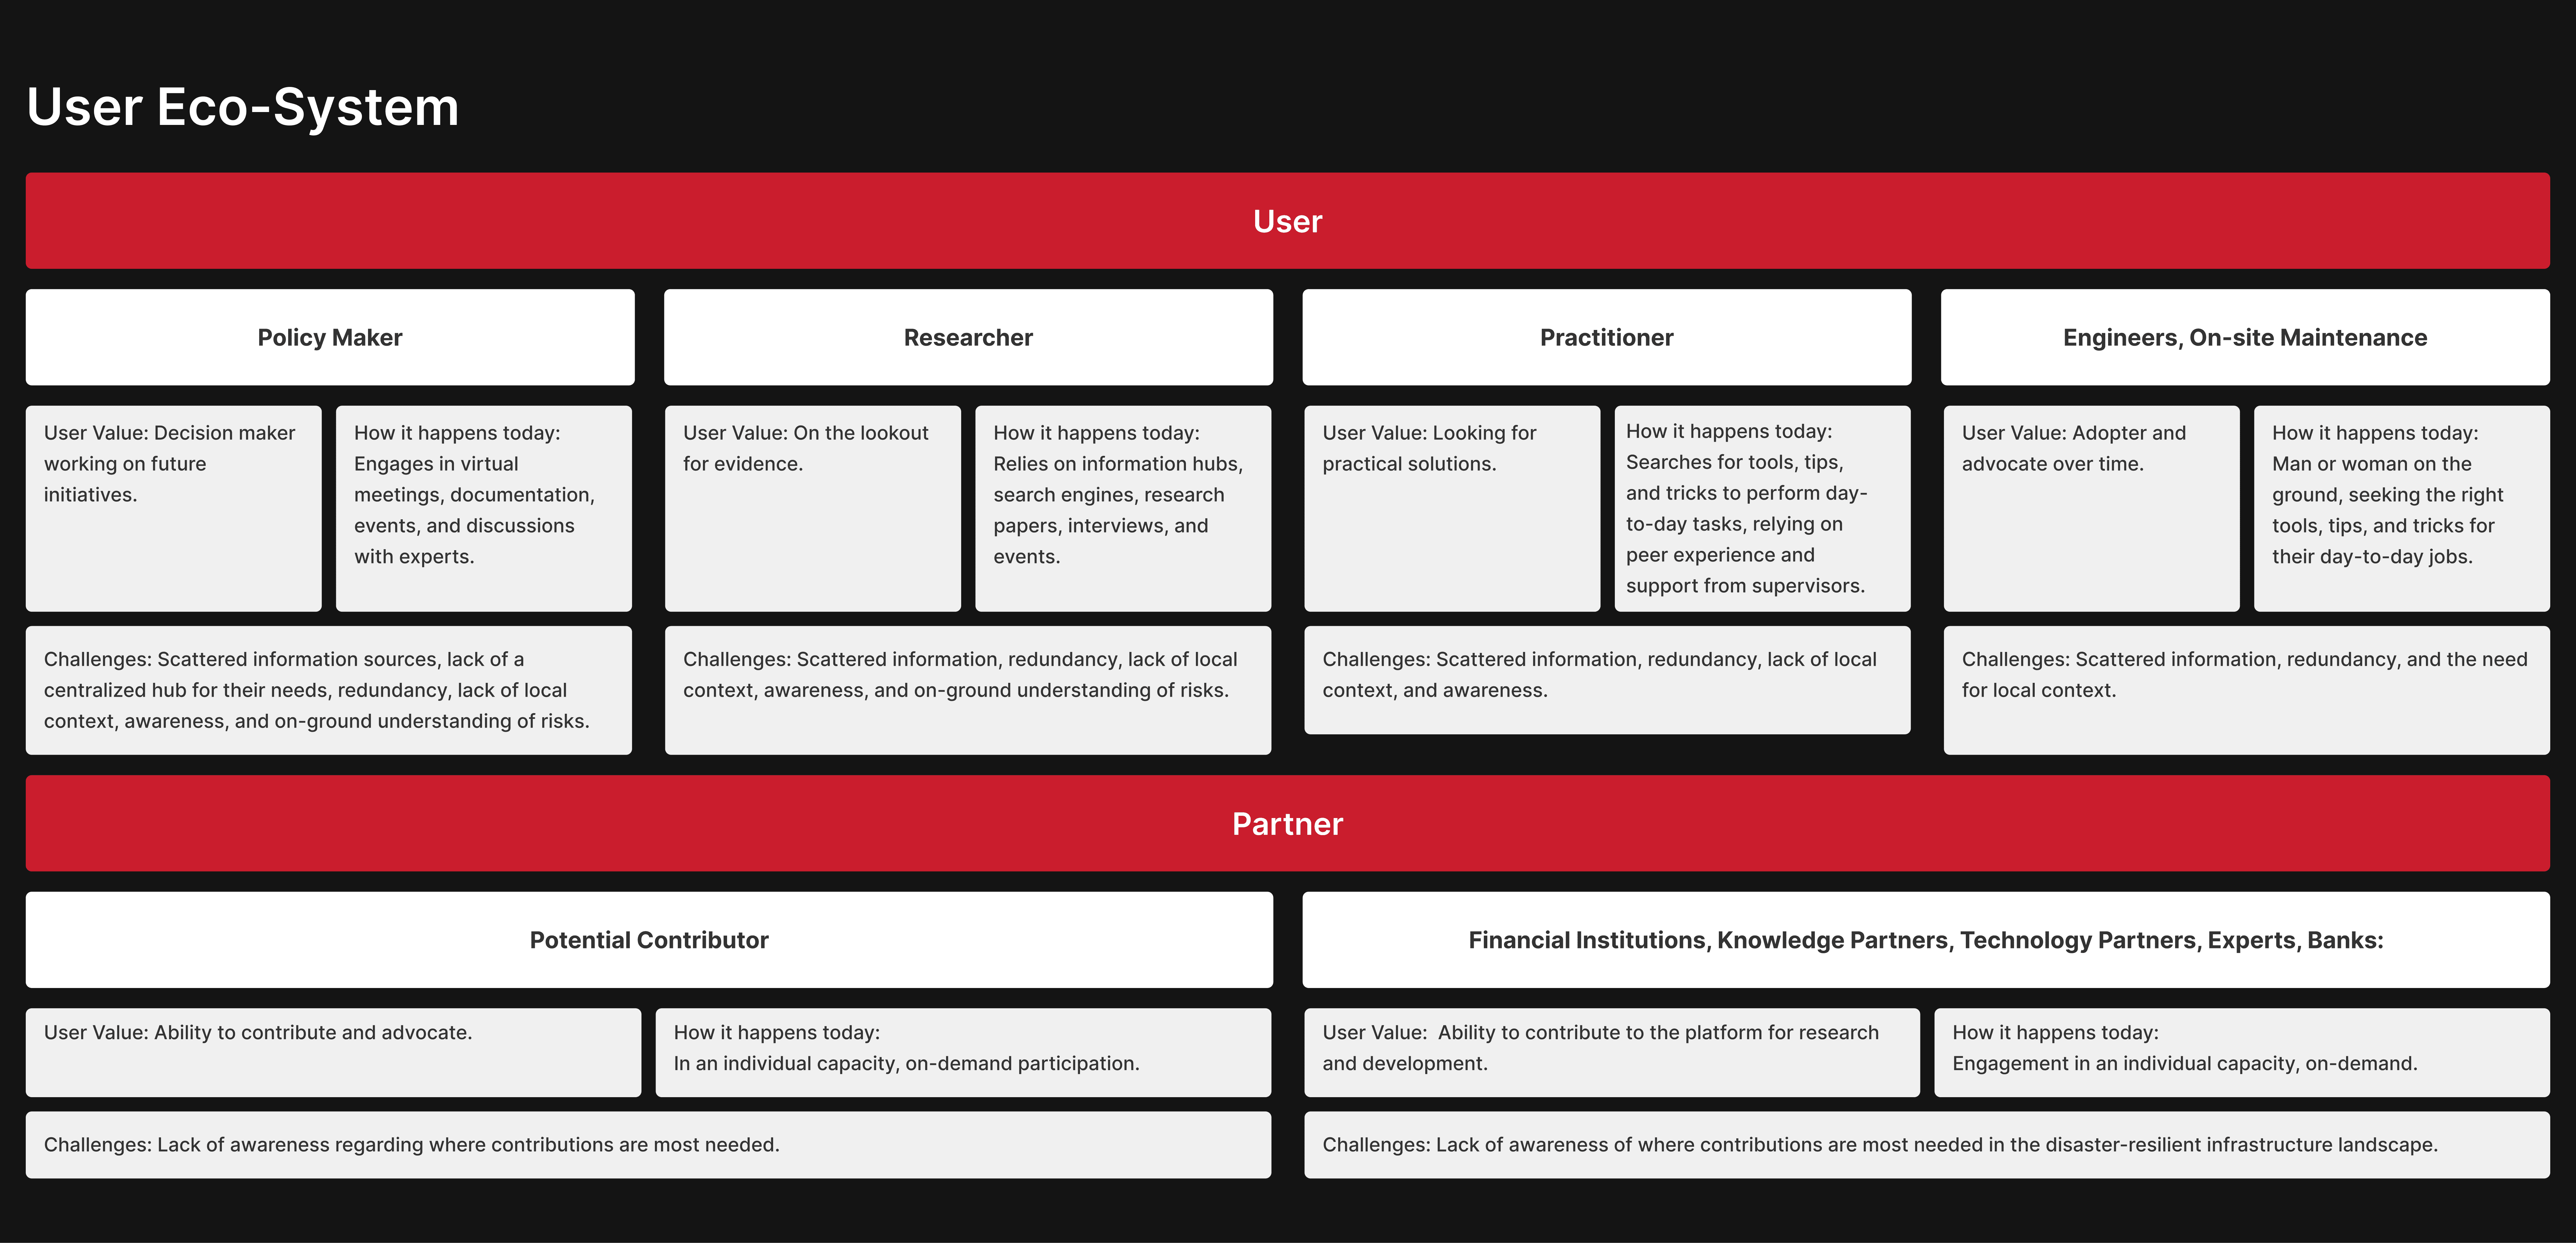
Through initial stakeholder conversations:
Knowledge was scattered across emails, shared drives, and offline forums.
Practitioners struggled to find expertise and resources.
Collaboration happened in silos, limiting cross‑regional learning.
There was no trusted community space for this field.
Users had varying levels of digital comfort and technical access.
Objective:
Create a platform that makes knowledge discovery, contribution, and collaboration simple and engaging for all users — from field engineers to policymakers.
Scope:
Research, information architecture, content strategy, interaction design, UI design, and a scalable design system.
Constraints:
Low-bandwidth regions, varied digital literacy, global neutrality, and the need for a structure that can grow over time.
Design Process
Phase 1: Discovery & Research (Week 1–2)
The first two weeks were about grounding the problem.
Spoke with practitioners, policymakers, partners, and internal CDRI teams.
Mapped how knowledge currently flows (or gets blocked).
Ran a competitive scan across similar platforms like ResearchGate, Coursera Communities, and Slack.
Identified motivations, friction points, and expectations across user groups.
Outcome: A clear picture of user needs, goals, and pain points — plus the confidence to move into strategy with evidence.
Phase 2: Strategy & Planning (Week 3–4)
With insights in place, I shaped the foundation of the product.
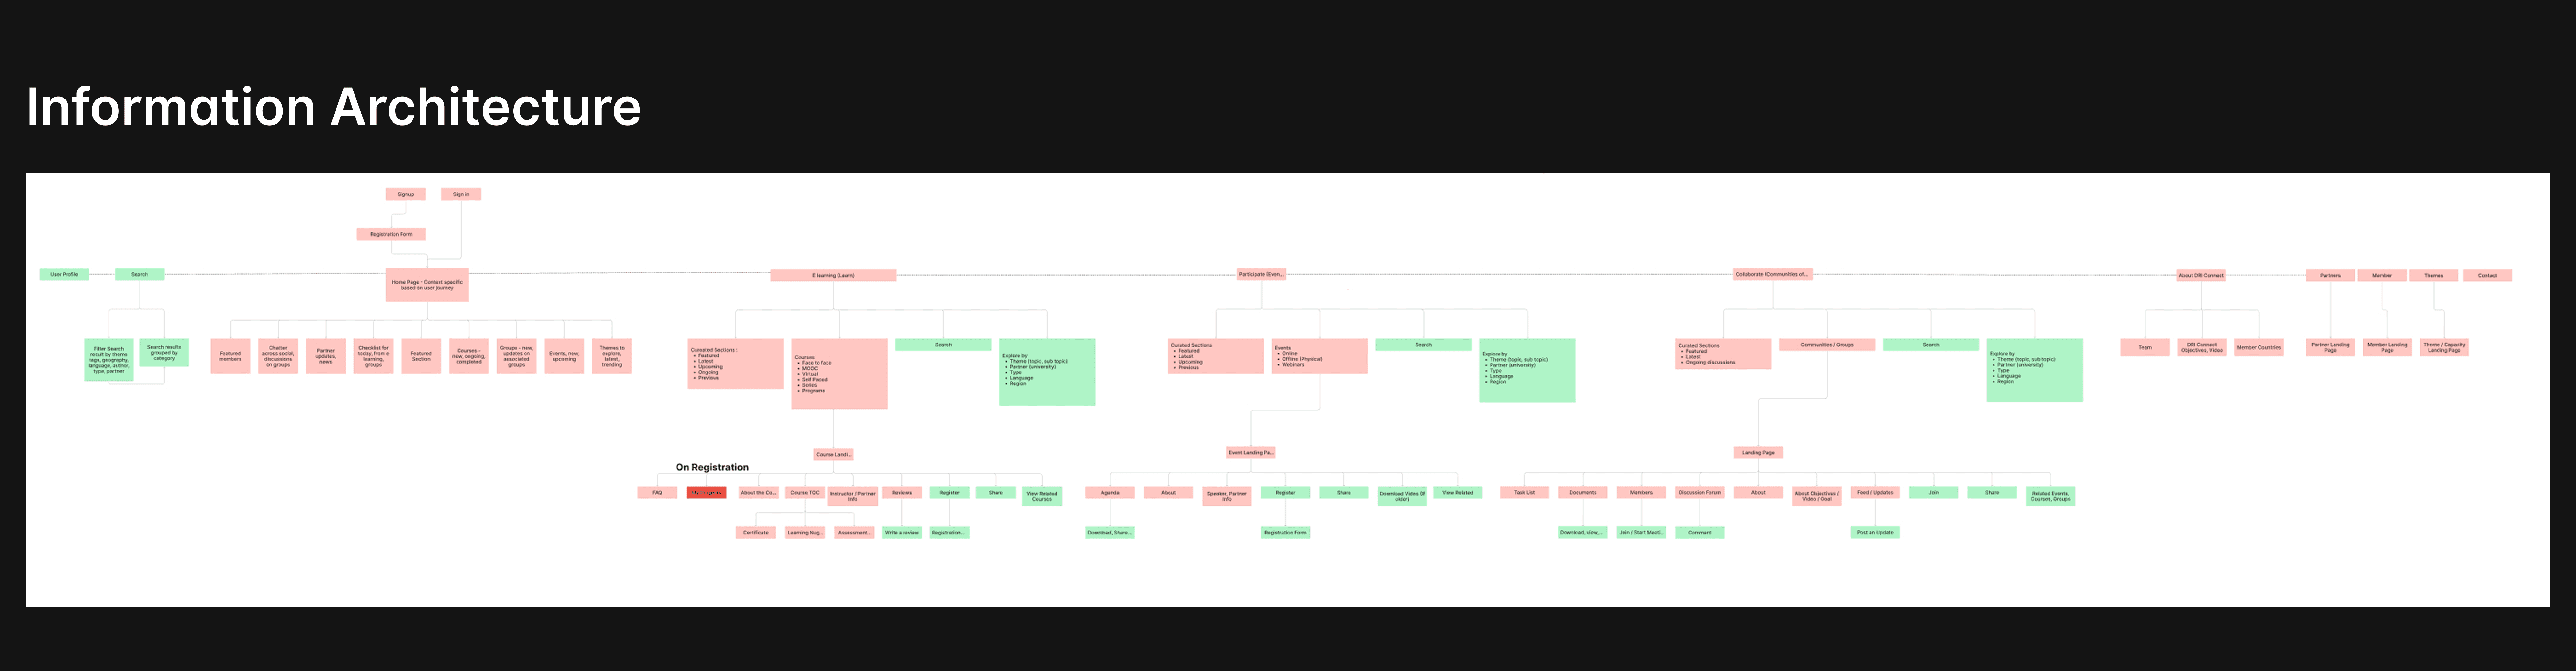
Defined the content architecture and tagged taxonomy.
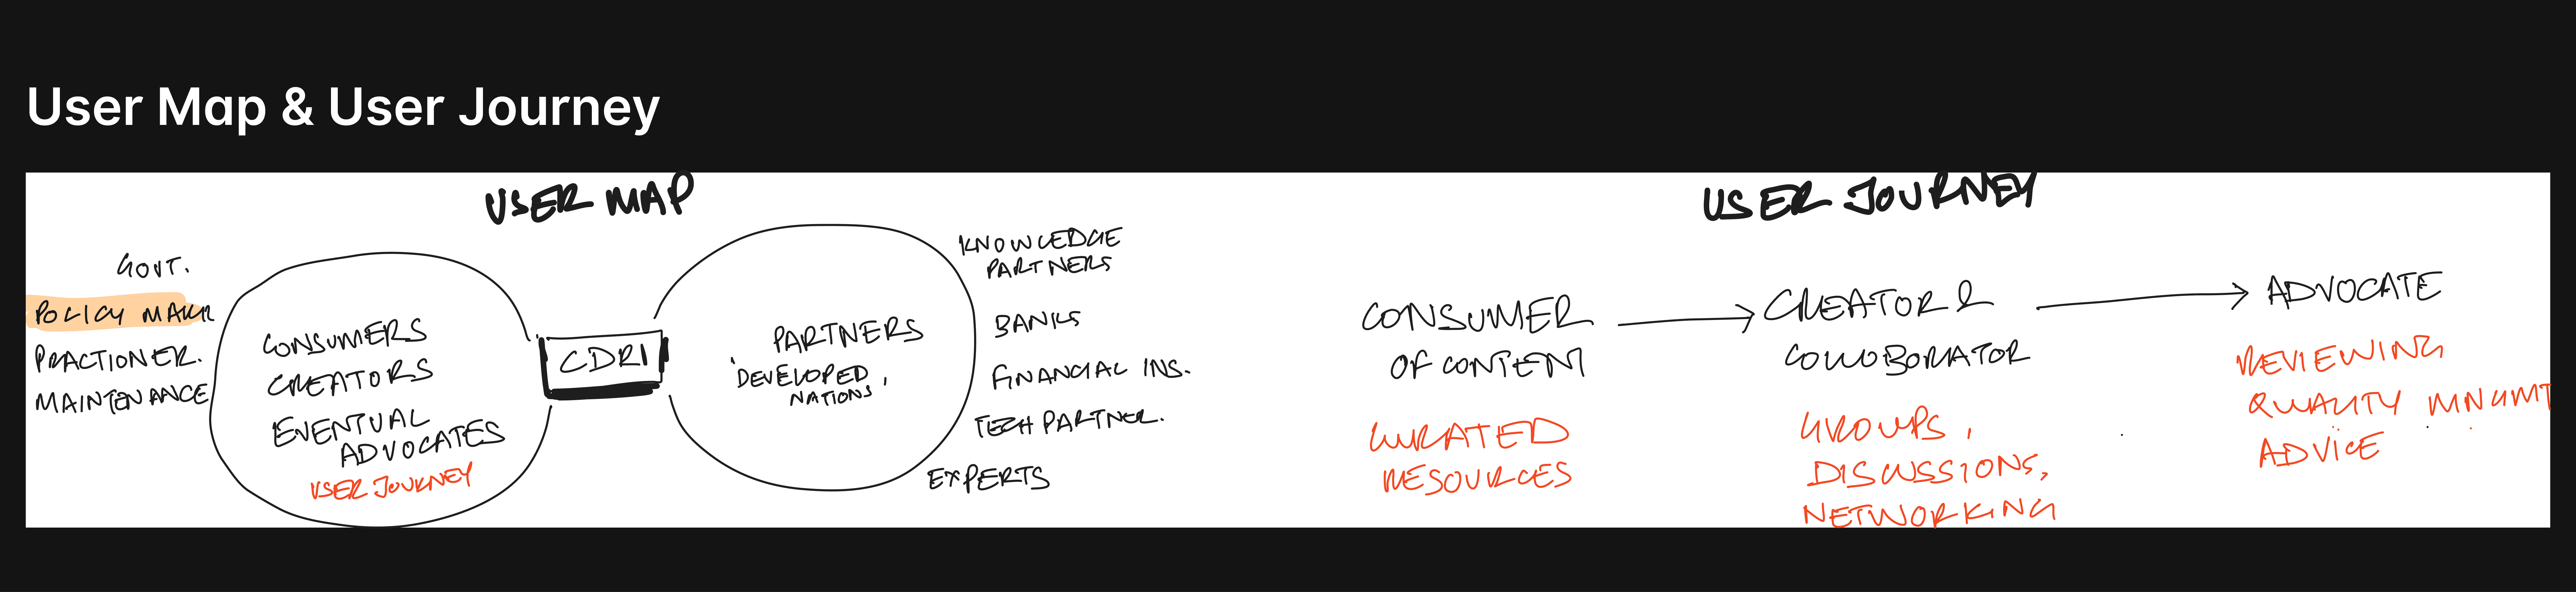
Mapped user journeys and contribution cycles.
Prioritized features for the MVP based on impact and feasibility.
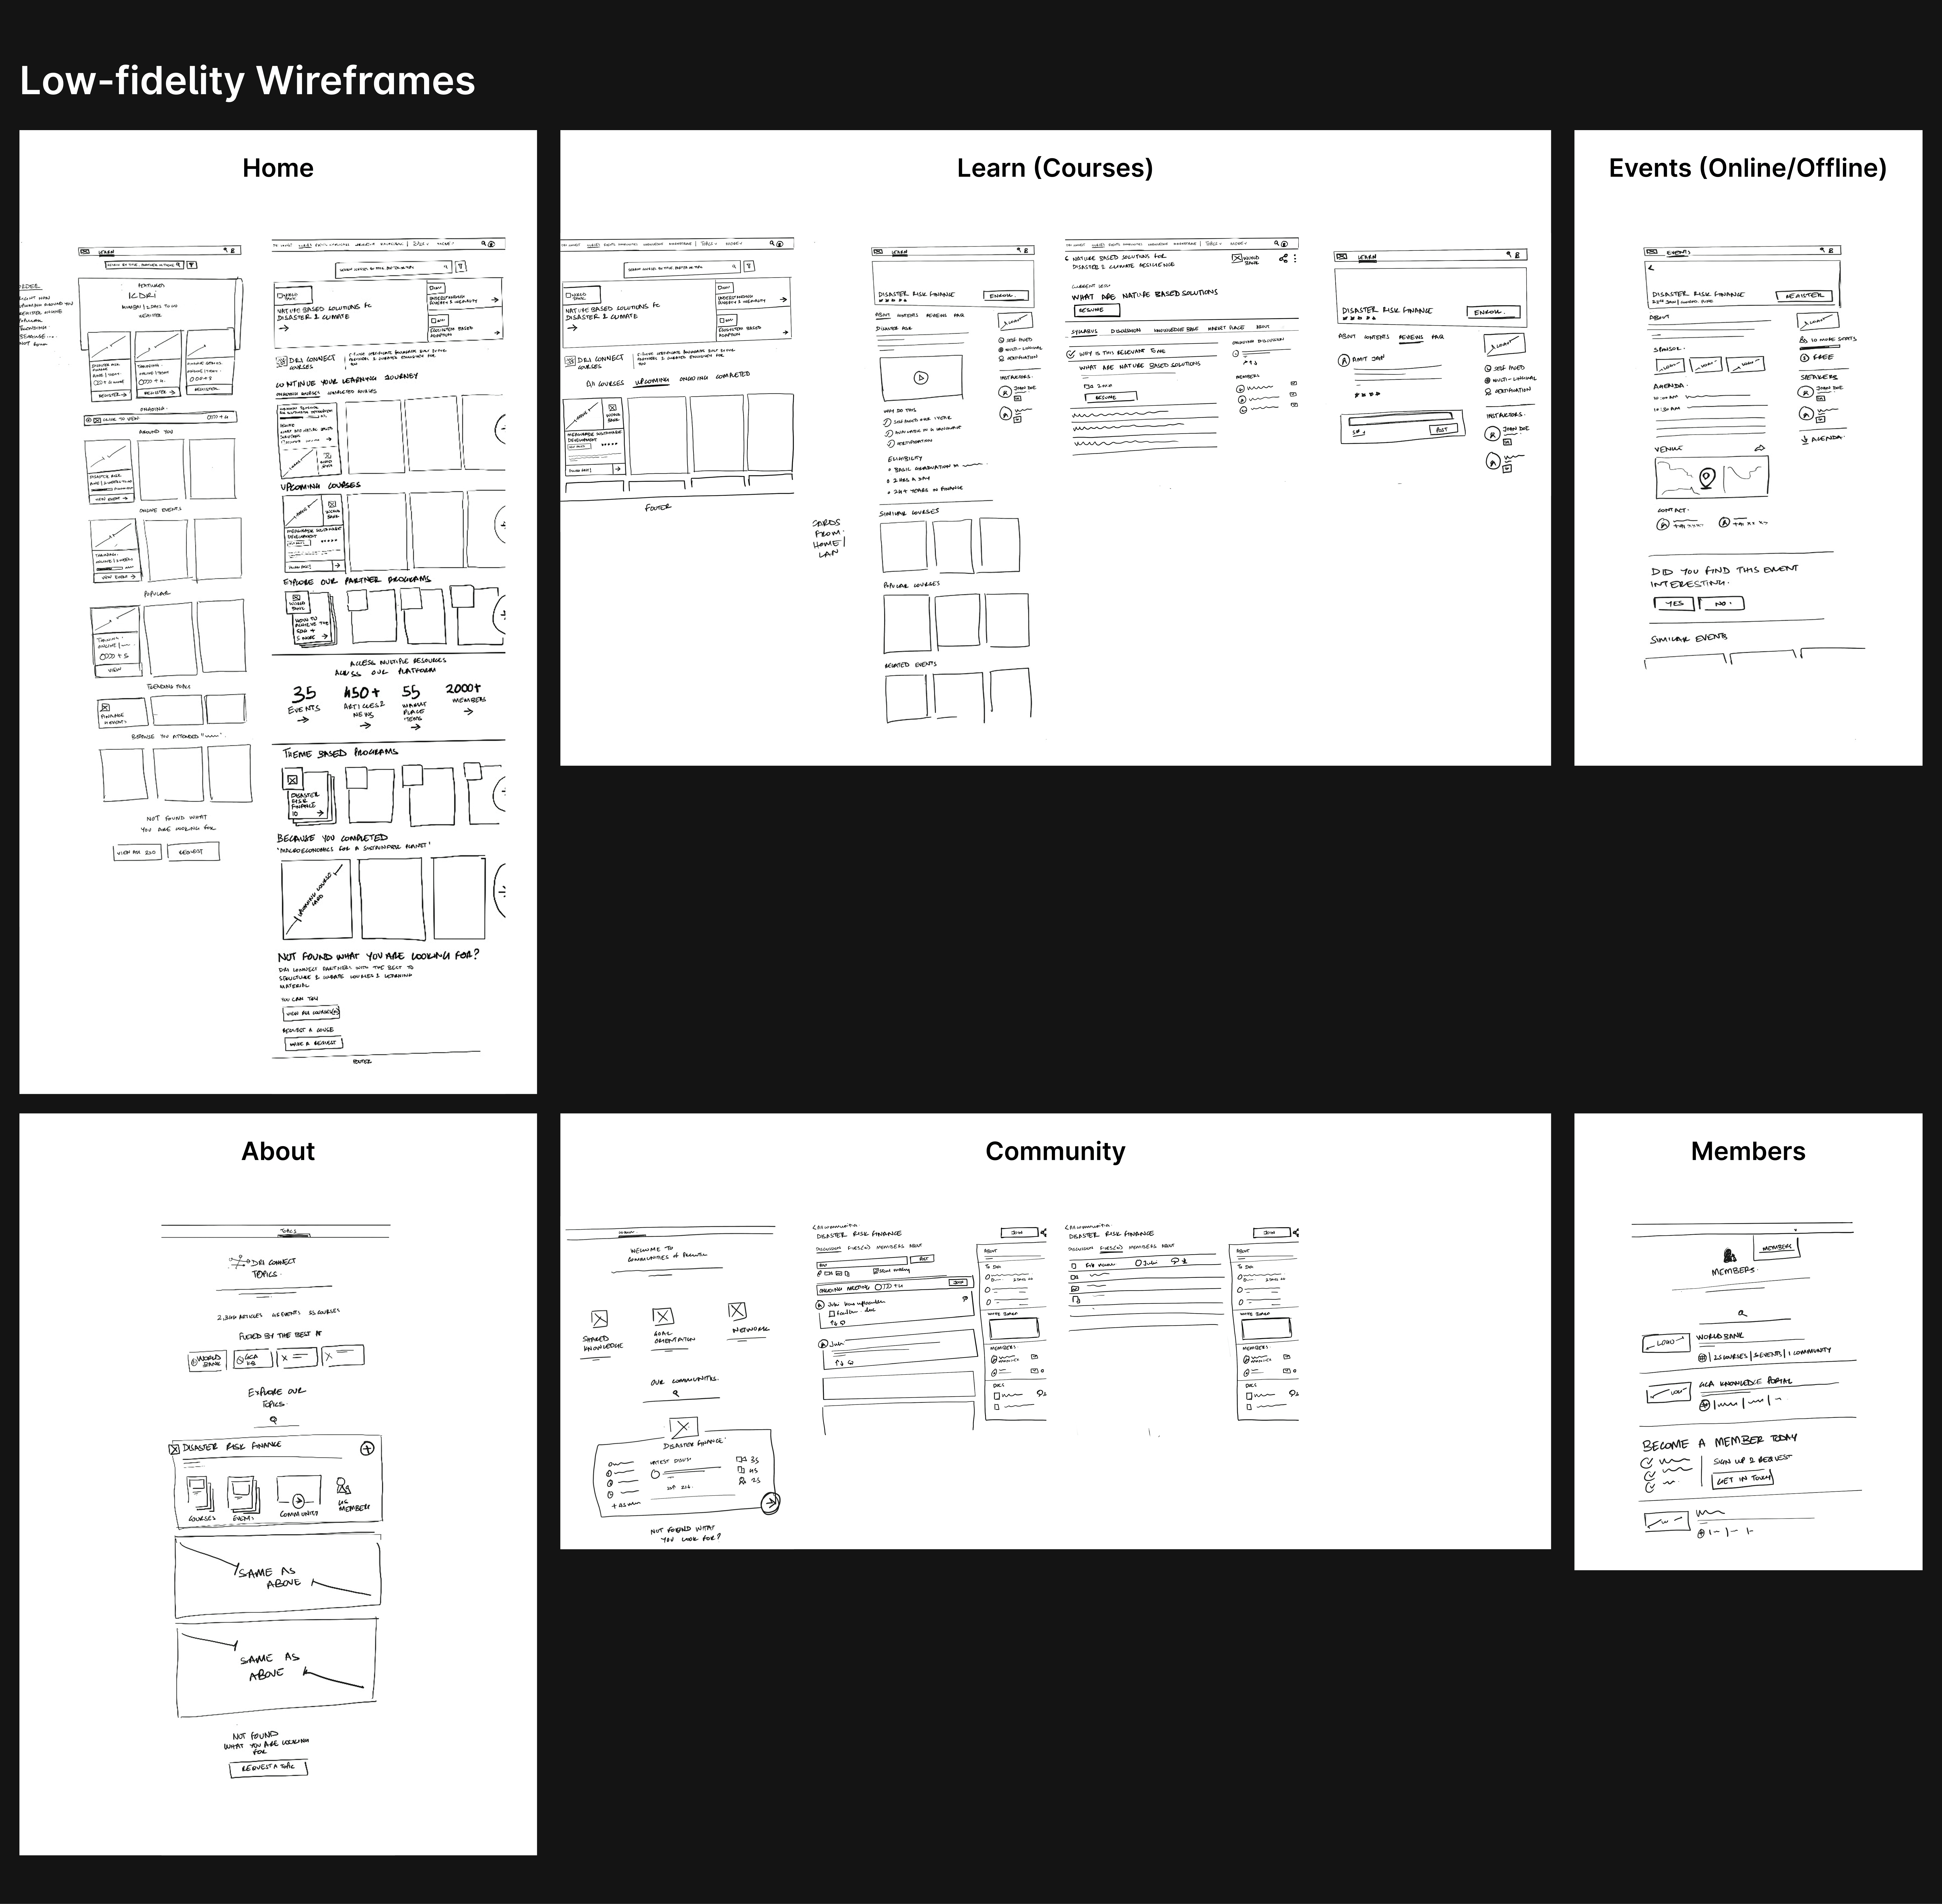
Created low-fidelity flows to test navigation and hierarchy early.
Outcome: A structured blueprint — information architecture, early flows, and a feature roadmap aligned with all stakeholders.
Phase 3: Design & Iteration (Week 5–10)
This phase brought the experience to life.
Designed mid- and high-fidelity wireframes for dashboards, knowledge modules, and collaboration spaces.
Built interactive prototypes to test clarity, navigation, and contribution workflows.
Iterated based on real feedback: simplified menus, clearer actions, faster search patterns.
Finalized the UI, visual language, and component library.

Design Challenges & Solutions
1. Information was scattered across many channels
Solution: A centralized knowledge hub with an intuitive taxonomy and personalized dashboards.
2. Engagement tended to drop after the first visit
Solution: Introduced contribution prompts, discussion threads, and recognition mechanics to keep users active.
3. Credibility of content varied
Solution: Added expert verification, peer endorsements, and transparent contributor profiles.
4. Users had mixed digital literacy and network conditions
Solution: Built lightweight interfaces, simplified actions, and ensured mobile-first performance.
Results & Reflection
Project Outcome
The final design exceeded initial expectations through multiple iteration cycles. The comprehensive redesign successfully established a strong digital brand presence that aligned with Atidiv's business objectives.
Key Achievements
Cohesive visual identity system implementation
Streamlined user experience with clear conversion paths
Professional presentation matching service quality
Fully responsive design across all devices
Strategic content organization supporting business goals
Personal Growth
This project reinforced the importance of thorough stakeholder collaboration when working as an external consultant. The iterative design process allowed for continuous refinement and ultimately delivered a solution that truly represented Atidiv's brand values.
What I Learned
Working without access to internal metrics required more reliance on qualitative feedback and stakeholder insights. This experience strengthened my ability to make design decisions based on business requirements and user experience principles rather than purely data-driven approaches.
Note on Metrics & Data Access
Often, contractors do not get access to metrics due to the nature of their contract. The systems are sometimes even designed specifically to prevent us from accessing them. The few times we have access to data is when we conduct user research, because we need to know. As an external consultant for Atidiv, I had no access to internal analytics or performance metrics, but worked directly with stakeholders to understand business needs and user pain points.